")
")


Energy Information Services (12)
The energy situation in the first eight months of 2015 and outlook for 2015
The energy situation in the first eight months of 2015
Thailand’s economic forecast 2015 by the Office of Economic and Social Development Board (NESDB.) point out that Thailand's economy is expanding in the range of 2.7 to 3.2 percent due to the acceleration of government spending and investment and the implementation of public investment. The oil prices and inflation are likely to remain low, it will help increase the real purchasing power of the people. However, the slowdown of the global economy, especially China, and the Ratchaprasong Explosion on August 17, 2015 that could affect the confidence of tourists there are also risks to the growth of Thai’s economy. It is expected that the average Dubai crude oil price in 2015 is in the range of 40.0 to 45.0 US dollars per barrel.
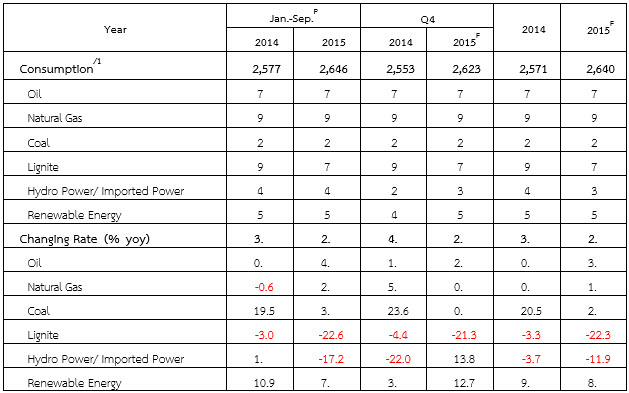
During the first eight months of 2015, the primary energy consumption is expected to be 2,603 thousand barrels of oil equivalent per day, increase from the same period in 2014 by 2.4 percent. Oil consumption is expected to increase by 4.0 percent as oil prices are likely to decrease. The natural gas consumption is expected to increase by 1.9 percent due to the increasing of power generation by Independent Power Producers (IPP) and Small Power Producer (SPP). The coal consumption is expected to increase by 4.0 percent due to their used in industry for the replacement of lignite that was decreased by constraints of volume production of lignite in the country. The consumption of lignite is expected to fall 21.6 percent compared to the same period last year. This is because of the shutdown for maintenance of lignite power plant and the reducing in electricity production of the Mae Moh power plant to make the transmission system more capacity for the synchronize testing of Hongsa power plant. The hydropower and electricity imports consumption are expected to decline 19.2 percent due to low rainfall over the past few years. This cause the amount of water used to produce electricity to be low. The renewable energy consumption is expected to rise 7.3 percent.
Primary Energy Consumption
Unit: kilo barrels of oil equivalent per day
|
|||||||||||||||||||||||||||||||||||||||||||||||||||||||||||||||||||||||||||||||||||||||||||||||||||||||||||
Remark/Pestimated from data as of August 2015
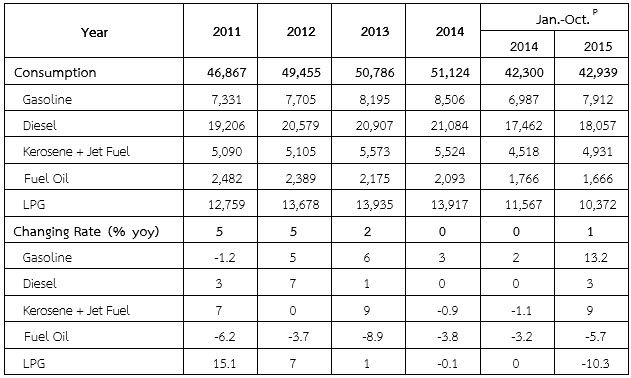
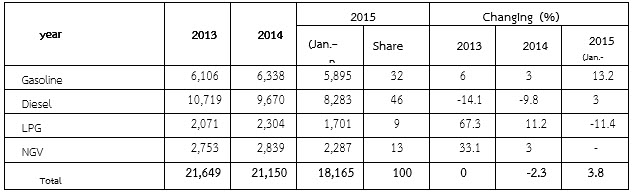
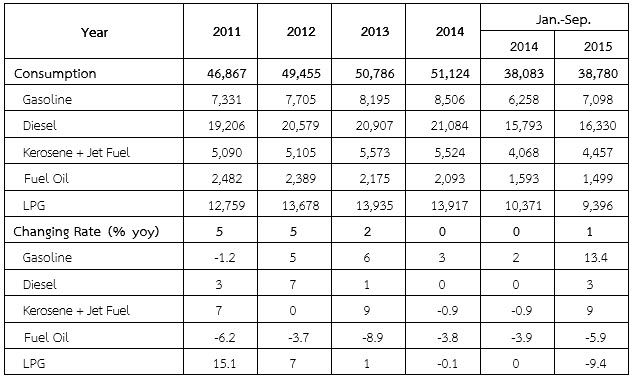
In the first eight months of 2015, the petroleum products consumption increased 2.2 percent. The demand of gasoline rose 13.3 percent due to the decrease of domestic gasoline retail price which was affected by the decline in oil prices in the world market. The expansions of the tourism sector make diesel and jet fuel consumption increased by 3.3 and 9.1 percent respectively. Use of fuel oil dropped 6.6 percent.
The LPG consumption in the first eight months of 2015 has decreased by 7.7 percent due to lower demand in transport, Household and petrochemical sector. LPG consumption in transportation sector have decreased 9.5 percent due to the increase of LPG prices, as oil prices fell, some customers turn to petroleum oil instead of LPG. In the household sector, The LPG consumption have decreased by 4.8 percent and steadily declined since the start of stringent measures to suppress the illegal distribution of LPG. While the industrial sector has increased LPG demand by 4.7 percent.
Petroleum Products Consumption
Unit: million liters
|
Year |
2011 | 2012 | 2013 | 2014 | Jan.-Sep.P | |
| 2014 | 2015 | |||||
| Consumption | 46,867 | 49,455 | 50,786 | 51,124 | 34,022 | 34,766 |
| Gasoline | 7,331 | 7,705 | 8,195 | 8,506 | 5,550 | 6,291 |
| Diesel | 19,206 | 20,579 | 20,907 | 21,084 | 14,182 | 14,657 |
| Kerosene + Jet Fuel | 5,090 | 5,105 | 5,573 | 5,524 | 3,660 | 3,994 |
| Fuel Oil | 2,482 | 2,389 | 2,175 | 2,093 | 1,433 | 1,338 |
| LPG | 12,759 | 13,678 | 13,935 | 13,917 | 9,196 | 8,487 |
| Changing Rate(%yoy) | 5.6 | 5.5 | 2.7 | 0.7 | -0.01 | 2.2 |
| Gasoline | -1.2 | 5.1 | 6.4 | 3.8 | 1.1 | 13.3 |
| Diesel | 3.8 | 7.1 | 1.6 | 0.8 | 0.3 | 3.3 |
| Kerosene + Jet Fuel | 7.7 | 0.3 | 9.2 | -0.9 | -0.1 | 9.1 |
| Fuel Oil | -6.2 | -3.7 | -8.9 | -3.8 | -3.8 | -6.6 |
| LPG | 15.1 | 7.2 | 1.9 | -0.1 | -0.5 | -7.7 |
Remark/Pestimated from data as of August 2015
Fuel consumption for land transport
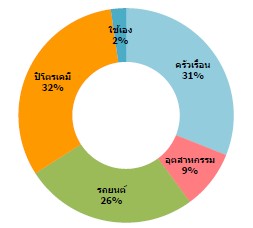
In the first eight months of 2015, the fuel consumption in land transport sector stood at 14,656 kilo tons of oil equivalent (ktoe) increase over the same period of the previous year by 4.3 percent. It is caused by an increase in the use of gasoline and diesel. The diesel (Holds up to 46 percent of energy use in all sectors of land transport) has increased by 3.3 percent compared to the same period last year.While the uses of LPG and NGV in the car (9 and 13vpercent, respectively) are down 9.6 and 1.3 percent, respectively, this is a major cause of the decline in prices. Gasoline and diesel steadily since mid-2014, and the price hike of LPG and NGV in 2014 for restructuring policies to reflect the true cost of government. The limitations of NGV service stations that still is not enough to make the use of LPG and NGV partial return to the oil.
In the first eight months of 2015, the average retail price of LPG and NGV is at 23.92 and 12.94 baht per kilogram), up 2.54 and 2.44 baht per kilogram, respectively, compare to the same period last year. While the cumulative NGV car is at 470,565, increase 3.5 percent, in August 2015. The NGV service stations at the end of August 2015 totaling 499 stations, up from the previous year, only 3 stations.
The Board of Energy Policy Administration on September 8, 2015 approved retail price of LPG and NGV at 22.29 and 13.50 baht per kilogram, respectively
The Energy Consumption in Land Transportation Sector
unit : ktoe
|
year |
2013 |
2014 |
2015 | Changing(%) | |||
| (Jan.–Sep.P) | Share(%) | 2013 | 2014 |
2015 (Jan.-Sep.P) |
|||
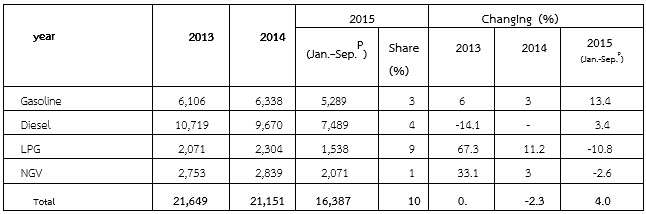
| Gasoline | 6,106 | 6,338 | 4,687 | 32 | 6.4 | 3.8 | 13.3 |
| Diesel | 10,719 | 9,670 | 6,722 | 46 | -14.1 | -9.8 | 3.3 |
| LPG | 2,071 | 2,304 | 1,382 | 9 | 67.3 | 11.2 | -9.6 |
| NGV | 2,753 | 2,839 | 1,866 | 13 | 33.1 | 3.1 | -1.3 |
| Total | 21,649 | 21,150 | 14,656 | 100 | 0.6 | -2.3 | 4.3 |
Remark /Pestimated from data as of August 2015
The production and consumption of electricity during the first eight months of 2015
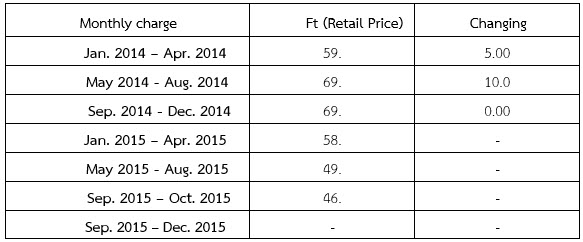
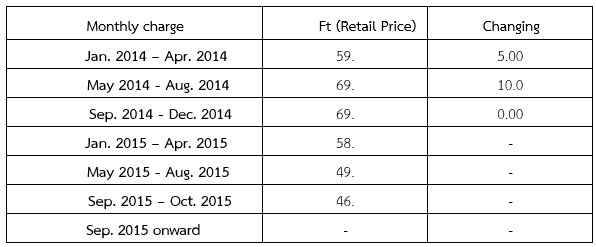
FT during May - August 2015 stood at 49.61 satang per unit, will be down 3.23 satang per unit in the September - December 2015 due to the drop of fuel prices in the world market, and the depreciate of exchange rate in the past.
The electricity consumption during the first eight months in 2015is approximated 116,350 gigawatt hours. It is increased 3.4 percent due to the hot weather in the summer and rainfall slower than last year. The electricity utilization increased in almost all sectors except agriculture.
The tariff formulated by automatically tariff adjustment formula (Ft).
Unit: Satang/unit
| Monthly charge | Ft(Retail Price) | Changing |
| Jan. 2014–Apr. 2014 | 59.00 | 5.00 |
| May 2014-Aug. 2014 | 69.00 | 10.00 |
| Sep. 2014-Dec. 2014 | 69.00 | 0.00 |
| Jan. 2015–Apr. 2015 | 58.96 | -10.04 |
| May 2015-Aug. 2015 | 49.61 | -9.35 |
| Sep. 2015–Oct. 2015 | 46.38 | -3.23 |
Price and value of Energy Import
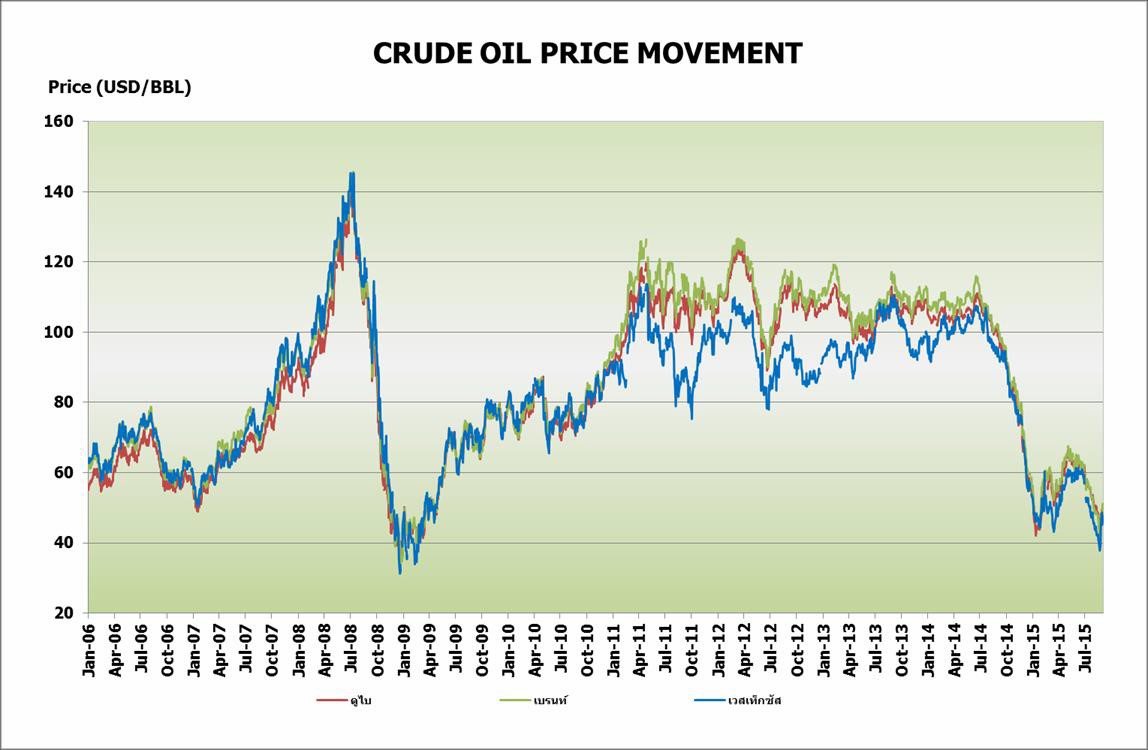
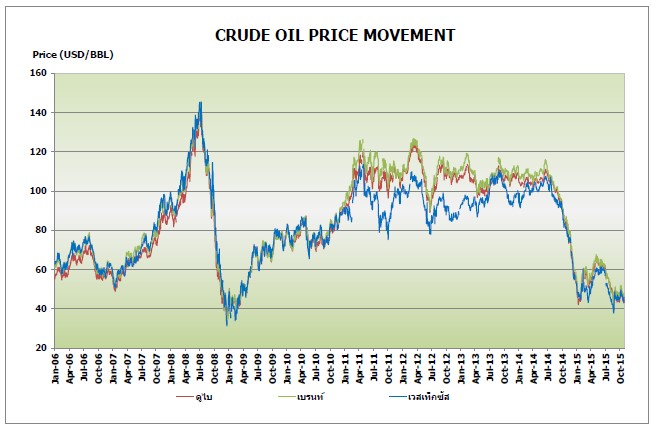
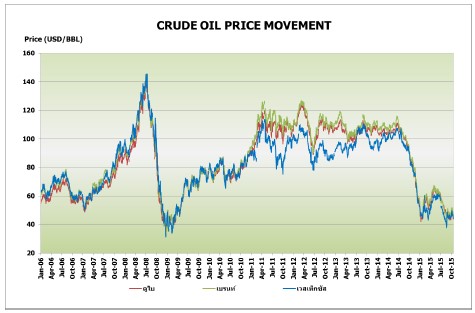
Crude oil prices (The average price of Dubai and West Texas) during August 2015 stood at US $ $47.69 and $42.77a barrel, down $8.47 and $8.12US dollars per barrel, respectively, compared to the average price in July 2015 due to the concerns over supply condition.
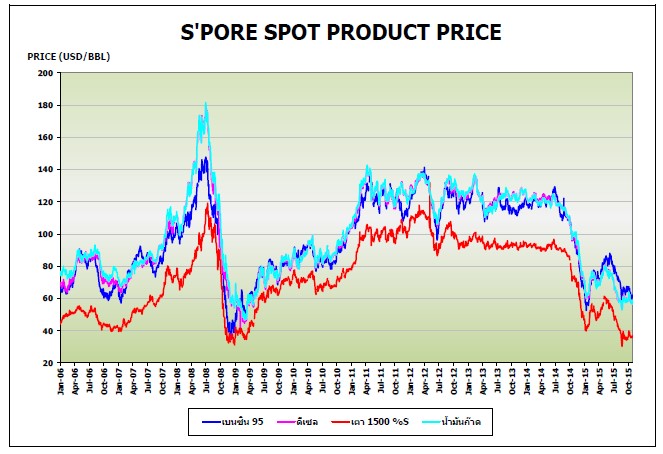
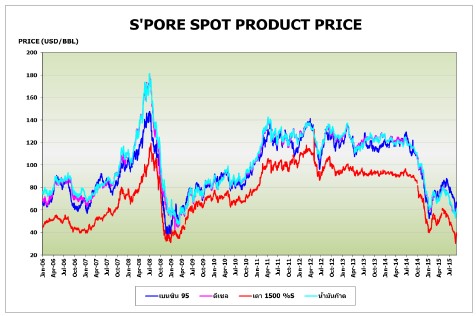
The price of gasoline and diesel fuel (average price in Singapore market) during August 2015 is at $65.98 and $57.04, down $9.97 and $8.04 per barrel compared to the average price in the previous month.
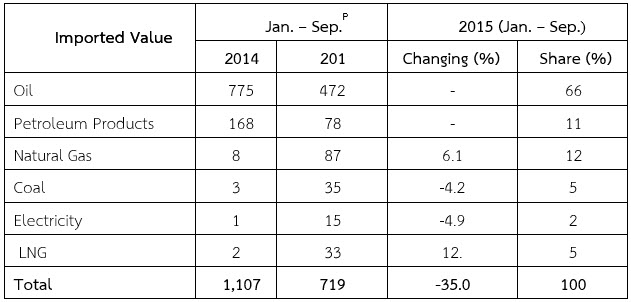
The total energy imported value during the first 8 months of 2015 was estimated at 654 billion baht, down 33.3 percent compared to the same period in 2014 due to a decrease in the price of imported energy. The import value of each type of energy is reduction. Except natural gas and liquefied natural gas (LNG) imports are increasing as the volume of imports. The value of imports increased by 11.7and 8.6 percent, respectively. The value of crude oil imported fell 36.7 percent according to crude oil price in the world market. The reduction of coal prices in the world market make the coal imported value fell by 5.9 percent compared to the same period last year. The value of imported petroleum products is down 53.8 percent due to the reduction of petroleum products volume and prices. The electricity imported value decreased 8.0 % by the reduction of imported volume.
Energy Imported Value
Unit: billion Baht
|
Imported Value |
Jan. – Aug.P | 2015(Jan. – Aug.) | ||
| 2014 | 20158 | Changing(%) | Share(%) | |
| Oil | 683 | 432 | -36.7 | 66 |
| Petroleum Products | 153 | 71 | -53.8 | 11 |
| Natural Gas | 70 | 78 | 11.7 | 12 |
| Coal | 33 | 31 | -5.9 | 5 |
| Electricity | 13 | 12 | -8.0 | 2 |
| LNG | 28 | 30 | 8.6 | 5 |
| Total | 980 | 654 | -33.3 | 100 |
Remark /P estimated from data as of August 2015
Energy Forecast and Information Technology Center
Energy Policy and Planning Office
October 28, 2015
The power crisis management plan
Ministry of Energy (MOEN) has a policy to make country Energy security by provided adequate and reliability of energy. The Energy crisis management preparation plan is the one plan that initiated to support country energy security. MOEN assigned EPPO to develop the Implementation Plan for the energy crisis and exercise to face the crises that happen in the future. EPPO has appointed a working group to prepare a plan for the electricity crisis. This group is responsible to study and introduce guideline for the management of the electricity system when the country faced to the crisis of energy. This is included the power crisis that formation in according to the current electricity situation. The working group has compiled a definition of energy crisis; mobilize the information on energy crisis preparation from the past and the current action plan for the power crisis management. WG has develop scenario on energy situation, analyzed and defined energy crisis and proposed management guidelines under the crisis scenario as follows.
1. Refer to the information from the past, almost of the crisis occurred in the EGATT system. It can be classified into three main scenarios.
1.1 The emergency on power generation system, this consist of the trip in power plants and the crashed of fuel feeding system which affects to reduce the frequency of the power system, to dropped voltage in some areas, to step down the spinning reserve levels, to make some areas power blackout and also affect to rise cost of electricity by utilizing fuel oil and diesel fuel to replace natural gas volumes that are missing.
1.2 The emergency on transmission system, this consist the collapse of electrical transmission towers by theft and the grid trip in many circuits. It is affected to low down the frequency and the security of transmission system, caused the Partial Blackout in the northeast zone and power outages in some areas.
1.3 The emergency on power equipment such as explosion of devices in the UPS System of National Control Center (NCC), the explosion and fire at transformer substation, flash over on 3 phase breaker and blade which resulted in a lack of control or out of control of NCC and blackout at power station occure. For emergencies that occur with Metropolitan Electricity Authority (MEA) and the Provincial Electricity Authority (PEA) is caused by the inadequate of EGAT generation system, disaster, the riots, making the recovery of power system back to normal use more time.
2. Action Plan for the energy crisis of the 3 electricity authority of Thailand was formulated 3 sub-action plan, The action plan for organization risk management , The action plan for facing emergency or abnormal events and the action plan for organization communication in emergency event, which was aim to protect Transmission system Power Distribution System from damage when crisis occur and to continuously delivery electricity service to the consumers during the crisis event.
2.1 The organization risk management plan of the 3 Authorities are as follows;
| EGAT | Plan for Organization Risk Management, the team of EGAT Deputy on the transmission System, in 2009, classifies risks into 6 areas: (1) the strategic and competition risk, (2) the financial risks (3) transmission system operations and the general operations risk (including information risk), (4) personnel risk (5) the communities and the environment risk, and (6) regulatory compliance risks. If any risks are linked and affect the operational or strategic issues of EGAT plans are set up to manage the risk in that area. |
| MEA | Organization risk management plans to prevent damage that may occur in the distribution system of the MEA. This is classified the risk into 5 areas, (1) antenna feed line damage that may cause harm to life and property, (2) damage to the distribution system and service due to natural disasters and other threats, (3) the loss of life and property due to the electrical system and service delays, (4) violation of MEA property is an upward trend, and (5) electrical equipment that is defective causing power outages and have 6 risk management plan to support the operation. |
| PEA | It has the monitoring system to support the business operations Management. The emergency events that affect/interrupt the business of PEA are as follow; (1) the 115 kV transmission line (2) power station (3) the 22-33 kV distribution system kV (4) the 400-230 V distribution system with a prioritization of action to recover and to assess the impact on business, The probability of irregular events occurring and It is defined programs / activities and responsible resource use in the operation. |
2.2 Action Plan for emergencies: the 3 authorities are formulated the action plan for emergency situations as follows.
| EGAT |
It develop 3 action plan for facing emergency event as follow; 1. Manual for coordination of the electrical control system and Instructions electrical blackout 2. Blackout Restoration Plan 2010 3. The emergency plan for generation system or natural gas pipelines interruption 2010 4. Contingency plans in case the electric power computers control system disruptions 5. The national electric power system control center evacuation plan 6. Manual for emergency plan in case of high voltage transmission towers collapsed 7. Manual for emergency plan in case of flooding 8. Manual for emergency plan in case of the wreck 9. Manual for emergency plan in case of fire. |
| MEA | Disaster Prevention and Mitigation Plan |
| PEA | PEA Action Plan in case of unusual events. |
The Demand Response Measure
what is demand response?
Demand Response (DR) is the promotion to encourage consumers to change their usage patterns in response to price electricity at different times. This is for reducing power peak demand which will benefit for the management of the electricity crisis and enhance energy security in both the short and long term.
Demand Response Measures to Reduce Power Peak in an electricity crisis of the past
During the years 2013-2014
| April 2013 | Campaign to reduce energy consumption across the country to resolve gas crisis in Yanada resource by the cooperation of industry and the public sector. |
| December 31, 2013 - January 20, 2014 | Open for voluntary application to reduce the electricity demand from the crisis of the Yanada resource. This is targeted for 200 MW but It actually gains 70 MW. |
| May - July 2014 | Campaign to reduce energy consumption in the south region to resolve gas crisis in JDA resource by the cooperation of industry and the public sector. |
| December 31, 2013 - January 20, 2014 | Open for voluntary application to reduce the electricity demand from the crisis of the JDA resource with electricity energy rebate. This is targeted for 247 MW but It actually gains 48 MW. |
In the years 2015
| April 2013 | Campaign to reduce energy consumption across the country to resolve gas crisis in Yanada resource by the cooperation of industry and the public sector. |
| December 31, 2013 - January 20, 2014 | Open for voluntary application to reduce the electricity demand from the crisis of the Yanada resource. This is targeted for 200 MW but It actually gains 70 MW. |
| May - July 2014 | Campaign to reduce energy consumption in the south region to resolve gas crisis in JDA resource by the cooperation of industry and the public sector. |
| December 31, 2013 - January 20, 2014 | Open for voluntary application to reduce the electricity demand from the crisis of the JDA resource with electricity energy rebate. This is targeted for 247 MW but It actually gains 48 MW. |
Types of Demand Response
DR can be categorized according to the type of response mechanism into two varieties.
1. Reliability-based Demand Response
It was Load demand response form at a time when the reliability of electricity system is low or unusual s or emergency event that risk to the stability of the power system occurs. This can be set the compensation price measure to suite the participated power user performance as follow;
- Direct Load Control Measure
- AutoDR to EMS Measure
- Curtailable/Interruptible Tariff Measure
- Emergency Demand Response Program
- Demand Bidding/Buyback Program
- Capacity Market Program
- Standby Generator Measure
- Energy Storage Measure
- Ancillary Service Measure
2. Price-based Demand Response
It used price mechanism for loading demand response. The high cost of electricity is set when the high electricity demand or a risk events that affected to the power system occurs. This aims to encourage the consumer to reduce electricity consumption or shift used time to the cheaper electricity prices period. The measures are as follow;
- Time of Use Rates Measure
- Critical Peak Pricing Measure
- Peak Time Rebate Measure
- Real Time Pricing Measure
Demand Response measures taken in the future
Currently, the Ministry of Energy has conducted research and implement the pilot measure on Direct Load Control and AutoDR to EMS measures, which makes more efficiency to control the power consumption and reduce the growth of power plant construction. The pilot was conducted in the industrial, business and residential sectors, such as 100 houses in housing demand response pilot project (DR100) by the Faculty of Engineering, Chulalongkorn University, and so on.
Thailand Energy Report 2015
Thailand Energy Report 2015
“In 2015, Energy production in Thailand decreased, resulting in more imports to meet domestic demand. The final energy consumption increased by 4.0% because the Thai economy started to recover (GDP grew by 2.8%) while the energy prices are in a downtrend due to the oversupply of oil, natural gas and coal in the world market. The prices of Diesel, Gasoline and Gasohol increased from the low level. The jet fuel consumption increased by the number of foreign tourists. The foreign Tourists were 29.9 million increases about 5 million people compare to previous year. The electricity consumption increased because the longer period of hot weather occurred and the expansion of the business sector is another key factor that affected the increasing electricity consumption in 2015.
The commercial primary energy production was at 1,026 thousand barrels of oil equivalent per day, down by 4.3%. Production of lignite decreased due to the reduction of Mae Moh power plant and industrial sectors demand. The hydroelectric decreased as well from the decreased of water reserve and the lower rain fall compared to the same period last year.
The net primary energy imported stood at 1,251 thousand barrels of oil equivalent per day. It is increase by 6.8%. The net import of energy was increased, In particular, the electricity imported that increased because the starting of electric supply from Hongsa power plant in Lao PDR., in February 2015. The import of natural gas increased since August 2014 by the selling of natural gas from the Zortica in Myanmar together with the increasing of LNG imports.
The final energy consumption was 1,420 thousand barrels of oil equivalent per day, or 4.0% up, according to Thailand's economy grew at 2.8%. it is a result of government stimulus policies that enhance the consumption and investment within the country. The 54% share of final energy
consumption is for petroleum products.
The value of energy imported was at 912,931 million baht, down 34.8%. The main factor that reduced energy imported value is the low of crude oil prices (crude oil has 65% share of the total Thailand energy imports) and the average price of imported crude oil in Thailand was at 54.3 US $ / BBL in 2015. The imported value of all kinds of energy reduced due to the reduction of energy prices except electricity and LNG imports increased because the expansion of imported volumes.
The value of energy exports stood at 218,472 million baht, down 31.3%, due in no crude exports from September 2557 to November 2558 in accordance with government policy.In December 2558, it began exporting crude oil from the Wassana Resource because the refineries in the country cannot be refined. The exported petroleum product price was lower compared to the previous year.
Energy Prices
Dubai crude oil price in December 2015 is averaged at 34.6 USD / BBL but the average price of 2015 was at 50.8 USD / BBL. The crude oil price was fluctuated because of the over oil supply that was affected by the slowdown of global economy growth and the levelize of oil production to maintain the market share of OPEC and Russia aAnd the El Nino phenomenon, resulting in temperatures in the Northern Hemisphere, higher than normal levels in the winter.
In December 2015, gasoline retail prices in the ASEAN region fell by almost countries except Brunei that has fixed prices. The retail price of diesel dropped by the whole region.
The price of LPG (CP) in December 2015 was 466 US $ / ton increase from the previous month in November 2015, which is at 411 US $ / ton. The retail price of LPG in the month of December 2015 stood at 22.29 baht / kg. This price was freeze in order to low down effect of the cost of living.
LNG prices in the world market dropped from oversupply in the world market and as a result of the weather in the East are not very cold, like every year. The oil price is low so it was used to replace some LNG in some country.
Crude oil supply is 1,028 thousand barrels per day by 85% of imports. The 8.8% increase in imports, mainly from Middle East countries. The rest is domestic production rose 10.0%, the refining capacity of the country stood at 1,252 thousand barrels per day. Crude was used in Refining for 90% of the refining capacity..
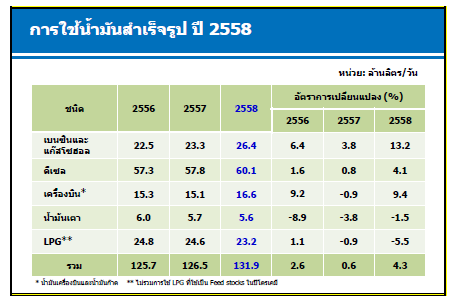
Petroleum products consumption is at 132 million liters per day, up 4.3%.
The diesel consumption is at 60.1 million liters per day accounted for 46% of all petroleum products. It is increased 4.1% by the prices reduction.
The consumption of gasoline and diesel fuel was at 26.4 million liters per day. Accounted for 20% of all petroleum products consumption. The demand rose to 13.2% due to the low oil prices that encourage the auto LPG and NGV users turning to use more oil because it is cheaper and more convenient evenly over the service station.
Jet fuel consumption was at 16.5 million liters per day, up 9.4% from the expansion in tourism sector. In 2015, the foreign tourists come to visit at 29.9 million people, up from about 5 million from the years ago.
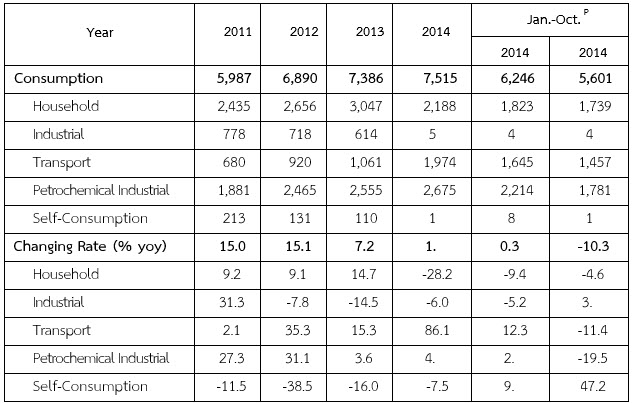
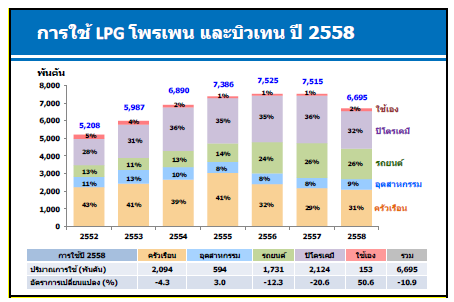
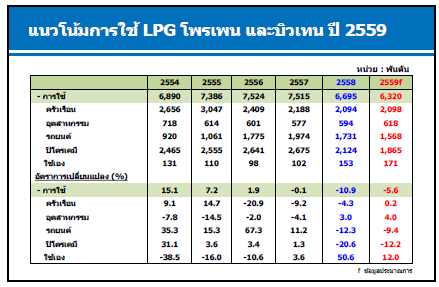
The LPG consumption was at 6,695 thousand tons, down 10.9%, the consumption of LPG in several sector will be described as follow;
Petrochemical industry (As raw material) accounted for most of the 32% decrease of 20.6% from the slowdown of downstream industries and the export sector is still shrinking.
Households sector accounted for 31%, down 4.3%, it was a result from the adjusting retail LPG prices structure to reflect actual costs, that effected the prices in household sector higher than the last year prices so there was no motive to smuggle LPG.
Automobile consumption fell 12.3% due to lower oil prices resulting that some users turn to oil instead of LPG.
Industry consume 3.0% up compared to the previous year by adjusting the price to equal the household and transportation sector price.
The refineries self-consumption increased to 50.6% due to excess LPG from other sector.
Natural Gas
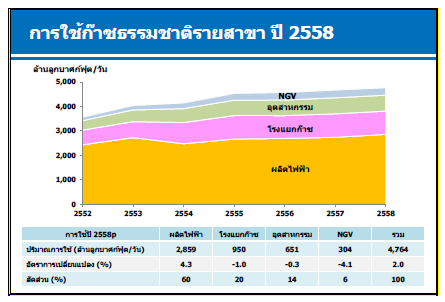
The natural gas consumption was at 4764 million cubic feet per day, up by 2.0%. It is increased 4.3% for electricity generation (share of NG for electricity generation is about 60%) while the consumption of NG in other sector were slowdown especially in the consumption as NGV that decreased by 4.1% from the price increased from last year. Another factor that affected to decrease NG consumption is the decreasing of oil price. The fell down of oil price and some limitation of NGV service station make some of NGV car owner convert their engine to use oil instead of NGV. There are only 500 NGV stations in the whole country at the end of December 2015.
Lignite / Coal
The supply of lignite / coal was at 37.1 million tons, down by 4.7% compared to previous year. Lignite production decreased by 15.7% from the domestic demand reduction. While imports of coal increased 4.8% by the increasing of the industrial sector consumption.
- The lignite consumption was at 15.1 million tons, down 17.8%. This is because of the decreasing in electricity production of Mae Moh power plant that was affected by limitations of the transmission line. Another reason was the feeding electricity in the transmission system of Hongsa power plant in February 2015 and the decreased of electricity consumption in the industrial sector.
The imported coal consumption was at 21.9 million tons, up 5.0%. The consumption is mainly in the industrial sector, which rose 11.4%, to replace lignite. While the imported coal consumption decreased in electric generation sector.
Electricity
The generation power in the electrical system at the end of December 2015 was at 38,815 MW (excluding the production of electricity from power plants VSPP). The EGAT has a maximum production capacity (40%), followed by the IPP (38 %), SPP (13%) and import / foreign exchange (9%).
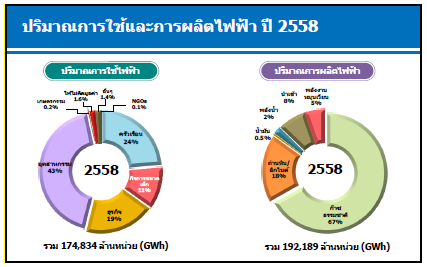
Electricity production was at 192,189 GWh (including the generation from VSPP) increased 3.3%. The fuels used to produce electricity are natural gas (67%), renewable energy (5%). The Production of electricity by RE increased 10.4% compared to last year. This is because of the promotion of RE in electricity generation of Ministry of Energy.
The Net Peak Generation Requirement occurred at 27,346 MW on Thursday, June 11, 2015 at 14:02 hrs. It is up 1.5% compared to last year, due to the hot weather for a long time, resulting in peak shift from April or May to be June this year.
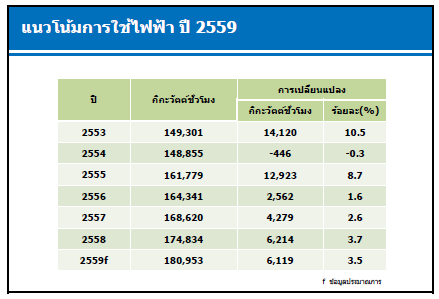
Power consumption was 174,834 GWh, increased 3.7% from the hot weather, and the expansion of the business sector especially in Tourism and construction sector. While the electricity consumption in the industrial sector was slowly increase because of a contraction of exports that impacted by the low expansion of global economy. Also the electricity consumption increased by nearly all economic sectors except for use in agriculture decreased due to serere drought.
CO2 emissions in energy consumptions
In 2015, a CO2 emission from energy consumption was at 254 million tons of CO2 increased by 1.6%. CO2 emissions came from the transportation, industrial and other economic sectors (including households, agriculture and commerce), while the CO2 emissions is reduced in electricity production. The CO2 emissions per energy consumption was at 1.96 tons of CO2 per KTOE. It is lower than the world average in 2013, which stood at 2.40 tons of CO2 per KTOE.
Data as of March 10, 2016
The energy situation in the first tenth months of 2015 and outlook for 2015
The energy situation in the first tenth months of 2015 and outlook for 2015
Office of Economic and Social Development Board (NESDB) forecasted that Thailand's economy in the 3rd quarter of 2015 will grow by 2.9 percent compared to the GDP growth in Q2 (Q2. the economy grew 2.8 per cent).
The expansion in agricultural manufacturing and export sectors are likely to be lower than expected but there are still driven by the tourism sector. Tourist is expected to arrive in the country up to 30 million people throughout the year.
However, Thailand's economy this year has been affected by drought and the global economic recovery continues to be delayed. The price of crude oil imports in 2015 was lower down. As a result, export prices on world markets fell. It forecasts that the average Dubai crude oil price in 2015 is at 52.5 USD per barrel lower than the assumption price of the forecast (Assuming that 50 - 60 USD per barrel).
The economic outlook for Thailand in 2016, NESDB. Is expected that it will expand by 3.0 - 4.0 percent by Government spending and public investment Including the stimulus and the recovery of global economic.
EPPO, Predicted that the final energy consumption in 2016 is expected to rise to 2.7 - 3.5 percent due to the economic recovery and oil prices remain low. This is consistent with the NESDB economic forecasted that Thailand's economy will expand by 3.0 - 4.0 percent
Electricity consumption in the first 10 months of 2015.
In the first 10 months of 2015, electricity consumption is expected to be 145,760 Gigawatt-hour Increased 3.2 percent because of the prolonged period of hot weather, the expansion of the business sector, especially tourism, business services and construction. Electricity consumption increased in almost every sectors except the agricultural sector that the consumption decline because of drought. The industrial sector accounts for the peak load representing 43 percent of total use. Electricity consumption has increased by 1.0 percent compared to the same period last year. The consumption of electricity in Household account for 24 percent of the total 5.2 percent increase in consumer spending due to the increase attributed to the hot weather. The small enterprises consumption and electrical appliances consumption have increased by 5.5 and 4.6 percent respectively.
Net Peak Generation Requirement in EGAT System was occurred at the temperature of 36.7 degrees Celsius on Thursday 11 June 2015 at 14.02 hrs. at 27 346 megawatts. It is higher than the Peak of the year which occurred on Wednesday, April 23, 2014 at 14:26 hrs. at 404 MW, an increase of 1.5 percent.
The predicted peak of the year 2016, EPPO, predicted Peak in two cases: 1) Base Case forecasts the Peak at 28,300 MW 2) If the temperature rises 3 degrees Celsius. predicted Peak was at 29,000 megawatts, the ministry has set up a surveillance at 28,500 megawatts.
The projected value Peak in the year 2016, if temperatures rise by 3 degrees Celsius, the expected value Peak is located at 29,000 MW, which is higher than the level of surveillance of the energy required by the government is taking measures to reduce the Maximum peak Demand by the following measures;
1) Measures “Demand Respond”
2) Measures Campaign "Energy divided by two."
3) Measures “Changed by high performance device”
FT during September - October 2015 stood at 46.38 satang per unit, down 3.23 satang per unit compared with the May - August 2015. In November 2015, the electricity bill will be restructured so the FT from November 2558 will be stood at -3.23 satang per unit.
The tariff formulated by automatically tariff adjustment formula (Ft).
- Unit: Satang/unit
In the first ten months of 2015, the petroleum products consumption was increased 1.5 percent. The demand of gasoline rose 13.2 percent due to a decrease of domestic gasoline retailed price which was affected by the decline in oil prices in the world market. The expansions of the tourism sector make diesel and jet fuel consumption increased by 3.4 and 9.2 percent respectively. Use of fuel oil dropped 5.7 percent.
The LPG consumption in the first ten months of 2015 has decreased by 10.3 percent due to lower demand in the high energy consumption proportion economic sector. Consumption in the petrochemical sector which has the highest proportion (32 percent) has decreased by 19.5 percent. In the households sector (with 31 percent share), The LPG consumption have decreased by 4.6 percent and steadily declined since the start of stringent measures to suppress the illegal distribution of LPG misuse. LPG consumption in transportation sector (26 percent share) have decreased 11.4 percent due to an increase in LPG prices, as oil prices fell, some turn to make use of petroleum fuel, instead of using LPG. While the industrial sector has increased LPG demand by 3.7 percent.
Petroleum Products Consumption
Unit: million liters
Remark /Pestimated from data as of September 2015
LPG include the utilized as feed stock of petrochemical
LPG, Propane and Butane Consumption
Unit: thousand tons
Remark /Pestimated from data as of October 2015
สัดส่วนการใช้ LPG ม ค -ต ค 2558
Fuel consumption for land transport
In the first 10 months of 2015, the fuel consumption in land transport sector stood at 18,165 kilo tons of oil equivalent (ktoe) increase over the same period of the previous year by 3.8 percent. It is caused by an increase in the use of gasoline and diesel. The diesel (Holds up to 46 percent of energy use in all sectors of land transport) has increased by 3.4 percent compared to the same period last year.While the uses of LPG and NGV in the car (9 and 13 percent, respectively) are down 11.4 and 3.3 percent, respectively, this is a major cause of the decline in prices. Gasoline and diesel steadily since mid-2014, and the price hike of LPG and NGV in 2014 for restructuring policies to reflect the true cost of government. The average retail price of LPG and NGV in the transport sector rose 2.08 and 2.45 baht per kg. The limitations of NGV service stations that still is not enough to make the use of LPG and NGV partial return to the oil.
In the first 10 months of 2015, the average retail price of LPG and NGV is at 23.55 and 13.05 baht per kilogram), up 2.08 and 2.45 baht per kilogram, respectively, compare to the same period last year. While the cumulative NGV car is at 471.392, increase 2.6 percent, in October 2015. The NGV service stations at the end of October 2015 totaled 500 stations, up from the previous year, only 4 stations.
The Energy Consumption in Land Transportation Sector
unit : ktoe
Remark /Pestimated from data as of October 2015
Price and value of Energy Import
Crude oil prices (The average price of Dubai) during October 2015 was at $46.02 a barrel, up 0.64 US dollars per barrel compared to the average price in September 2015 due to the concerns over supply condition.
The price of gasoline and diesel fuel (average price in Singapore market) during the month of October 2015 was at US $ 63.54 a barrel, down 1.70 US dollars per barrel compared to the average price in the previous month due to inventory is high. While diesel averaged price is at US $ 59.21 a barrel low down 0.27 US dollars per barrel due to increasing of demand from the starting operation of oil refinery. However, diesel prices fell less than the price of gasoline due to increased demand from Asian countries.
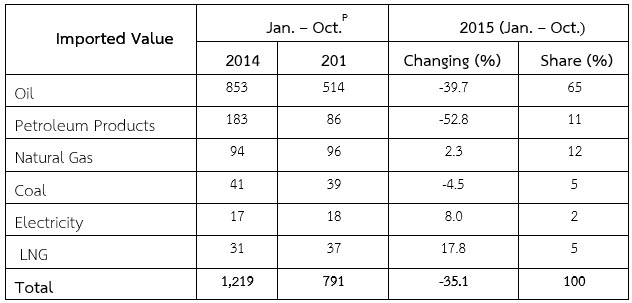
The total energy imported value during the first 10 months of 2015 was estimated at 791 billion baht, down 35.1 percent compared to the same period in 2014 due to a decrease in the price of imported energy. The import value of each type of energy is reducing. Except natural gas, electricity and liquefied natural gas (LNG) imports are increasing as the volume of imports. The value of imports increased by 17.8, 8.0 and 2.3 percent, respectively. The value of crude oil imported fell 39.7 percent according to crude oil price in the world market. The reduction of coal prices in the world market make the coal imported value fell by 4.5 percent compared to the same period last year. The value of imported petroleum products is down 52.8 percent due to the reduction of petroleum products volume and prices.
Energy Imported Value
Unit: billion Baht
Remark /P estimated from data as of October 2015
Energy Forecast and Information Technology Center
Energy Policy and Planning Office
November 24, 2015
The energy situation in the first nine months of 2015 and outlook for 2015
The energy situation in the first nine months of 2015 and outlook for 2015
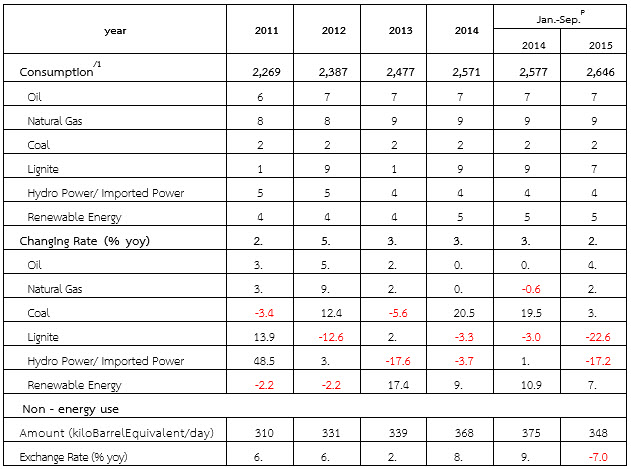
During the first nine months of 2015, the primary energy consumption is expected to be 2,646 thousand barrels of oil equivalent per day, increase from the same period in 2014 by 2.7 percent. Oil consumption is expected to increase by 4.1 percent as oil prices are likely to decrease. The natural gas consumption is expected to increase by 2.4 percent due to the increasing of power generation by Independent Power Producers (IPP) and Small Power Producer (SPP). The coal consumption is expected to increase by 3.8 percent since been used in industry for the replacement of lignite that was decreased by constraints of volume production of lignite in the country. The consumption of lignite is expected to fall 22.6 percent compared to the same period last year. This is because of the shutdown for maintenance of lignite power plant and the reducing in electricity production of the Mae Moh power plant to make the transmission system more capacity for the synchronize testing of Hongsa power plant. The hydropower and electricity imports consumption are expected to decline 17.2 percent due to low rainfall over the past few years. This cause the amount of water used to produce electricity low. The renewable energy consumption is expected to rise 7.3 percent.
Primary Energy Consumption
Unit: kilo barrels of oil equivalent per day
Remark /1 not include Non – Energy use
/Pestimated from data as of September 2015
In the first nine months of the year 2015, the petroleum products consumption was at 142 million liters per day increased 1.8 percent. The demand of gasoline rose 13.4 percent due to a decrease of domestic gasoline the retail price which was affected by the decline in oil prices in the world market. The expansions of the tourism sector make diesel and jet fuel consumption increased by 3.4 and 9.6 percent respectively. Use of fuel oil dropped 5.9 percent from its use as a fuel to produce electricity.
The LPG consumption in the first nine months of 2015 has decreased by 9.4 percent due to lower demand in the high energy consumption proportion economic sector. Consumption in the petrochemical sector which has the highest proportion (32 percent) have decreased by 17.2 percent. In the households sector (with 31 percent share), The LPG consumption have decreased by 4.9 percent and steadily declined since the start of stringent measures to suppress the illegal distribution of LPG misuse. LPG consumption in transportation sector (26 percent share) have decreased 10.8 percent due to an increase in LPG prices, as oil prices fell, some turn to make the use of petroleum fuel, instead of using LPG. While the industrial sector has increased LPG demand by 3.8 percent.
Petroleum Products Consumption
Unit: million liters
Remark LPG include the utilized as feed stock of petrochemical
LPG, Propane and Butane Consumption
Unit: thousand tons

Fuel consumption for land transport
In the first nine months of 2015, the fuel consumption in land transport sector stood at 16 386 kilo tons of oil equivalent (ktoe) increase over the same period of the previous year by 4.0 percent. It is caused by an increase in the use of gasoline and diesel. The diesel (Holds up to 46 percent of energy use in all sectors of land transport) has increased by 3.4 percent compared to the same period last year.While the uses of LPG and NGV in the car (13 and 9 percent, respectively) are down 10.8 and 2.6 percent, respectively, this is a major cause of the decline in prices. Gasoline and diesel steadily since mid-2014, and the price hike of LPG and NGV in 2014 for restructuring policies to reflect the true cost of government. The average retail price of LPG and NGV in the transport sector rose 2.38 and 2.50 baht per kg. The limitations of NGV service stations that still is not enough to make the use of LPG and NGV partial return to the oil.
The current retail price of LPG and NGV is at 22.29 and 13.50 baht per kilogram (Approved by the Board of Directors Energy Policy Administration on September 8, 2015), while the number of NGV service stations at the end of September 2015 totaled 500 stations, up from the previous year, only 4 stations.
The Energy Consumption in Land Transportation Sector
unit : ktoe
Remark /P estimated from data as of September 2015
The production and consumption of electricity during the first nine months of 2015
FT during September - October 2015 stood at 46.38 satang per unit, down 3.23 satang per unit compared with the May - August 2015. In November 2015, the electricity bill will be restructured so the FT from November 2558 will be stood at -3.23 satang per unit.
The electricity consumption during the first nine months of the year 2015is approximated to be 130,800 gigawatt hours. It is increased 3.2 percent due to the hot weather in the summer and rainfall slower than last year. The electricity utilization increased in almost all sectors except agriculture.
The tariff formulated by automatically tariff adjustment formula (Ft).
Unit: Satang/unit
Price and value of Energy Import
Crude oil prices (The average price of Dubai) during the month of September 2015 stood at US $ 45.38 a barrel, down 2.32 US dollars per barrel compared to the average price in the month of August 2015 due to the concerns over supply condition.
The price of gasoline and diesel fuel (average price in Singapore market) during the month of September 2015 is at US $ 65.24 a barrel, down 0.74 US dollars per barrel compared to the average price in the previous month due to inventory is high. While diesel averaged price is at US $ 59.48 a barrel rose 2.44 US dollars per barrel due to increased demand from China, Vietnam, Myanmar and West Africa and several refineries were shut down for maintenance.
The total energy imported value during the first 9 months of 2015 was estimated at 719 billion baht, down 35.0 percent compared to the same period in 2014 due to a decrease in the price of imported energy. The import value of each type of energy is reduction. Except natural gas and liquefied natural gas (LNG) imports are increasing as the volume of imports. The value of imports increased by 12.2 and 6.1 percent, respectively. The value of crude oil imported fell 39.2 percent according to crude oil price in the world market. The reduction of coal prices in the world market make the coal imported value fell by 4.2 percent compared to the same period last year. The value of imported petroleum products is down 53.6 percent due to the reduction of petroleum products volume and prices. The electricity imported value decreased 4.9 % by the reduction of imported volume.
Energy Imported Value
Unit: billion Baht
Remark /P estimated from data as of September 2015
Trends in energy consumption in 2015
Primary energy demand forecast for the fourth quarter of 2015 is estimated at 2623 thousand barrels of oil equivalent per day increase of 2.8 percent compared to the same period in 2014. It is expected that there will be increased demand for each kind of energy except the lignite consumption is expected to decrease as domestic production volumes of lignite continues steadily declined. It expected at 21.3 percent demand reduction. Oil consumption is expected to increase by 2.7 percent as oil prices are likely to stay low. It is because of the expansion in tourism sector. It affected that gasoline, diesel and jet fuel consumption has increased as well as the first nine months of 2015. Natural gas consumption during the fourth quarter of 2015 is expected to increase by 0.4 percent. Hydropower / electricity imports are expected to have a 13.8 percent increase. This is because the increasing of electricity imports by the commercial commissioning of Hongsa Power Plant Unit 2 in November 2015. While the use of coal in the fourth quarter of 2558 is expected to increase slightly. (increase 0.1 percent compared to the same period of 22014) and the renewable energy is expected to increase at 12.7 percent by the enhancing renewable energy utilization policies of Ministry of Energy.
The primary energy consumption in 2015 is estimated at 2,640 thousand barrels of oil equivalent per day increase 2.7 percent compared with the year 2014. It expand according to the 2015 economic growth. Predicts that the use of oil for the year 2558 will increase by 3.7 percent for gasoline, diesel and jet fuel. The use of natural gas will increase by 1.9 percent and the coal consumption is expected to increase at 2.8 percent to replace the need of lignite in industrial sector. It is expected that the lignite consumption in 2015 will be down to 22.3 percent based on the decline production volumes by the private of lignite mining and manufacturer. The maintenance of Mae Moh power plant and limitations of the transmission system after the synchronize of Hongsa power plant will decrease the consumption of lignite too. While the use of hydropower and electricity imports are expected to decline 11.9 percent from hydroelectric power drop during the dry season and the less rain fall in 2015. In the year 2015, the renewable energy consumption is expected to increase by 8.6 percent compared to the previous year.
The petroleum products consumption in 2015 is expected to increase by 1.2 percent. The gasoline consumption increased by 12.5 percent due to the drop in gasoline prices, especially in the first half, by the decreasing of gasoline average retail price that affected to rise up the consumption of gasoline to 14.0 percent For diesel, are expected to have increased by 3.3 percent and jet fuel rose 8.1 percent based on the expansion of the tourism sector.
The LPG consumption in 2015 is estimated to have decreased 10.7 percent due to lower demand for household use in the transportation sector and the petrochemical industry. Using the car is expected to decline 11.9 percent due to an increase in LPG prices, as oil prices fell, some turn to make the use of LPG instead of gasoline. The household sector decreased by 4.1 percent. For use in the petrochemical industry is expected to have decreased by 20.6 percent due to the impact of the export slowdown while the manufacturing sector is estimated to have increased by 3.4 percent due to lower prices on the market.
Electricity consumption in 2015 is expected to have a power rating of 173 862 GWh increased 3.1 percent compared to the year 2014. This because the increasing of electricity consumption in almost economic sector except for agriculture which has been affected by drought.

Estimated Primary Energy Consumption
Unit : Kilo Barrel of Oil Equivalent/day
หมายเหตุ /1Not include Non – Energy use
/Pestimated from data as of September 2015
/Festimated from data as of 4th semester of 2015
Energy Forecast and Information Technology Center
Energy Policy and Planning Office
October 28, 2015
Energy Situation in year 2015 and trend in year 2016
Energy Situation in year 2015 and trend in year 2016
Energy Situation in year 2015
Energy Policy and Planning Office (EPPO) prepared the Thailand Energy Situation 2015 Report. This report indicated that, Thailand primary energy consumption increased by 1.8 percent compared to the previous year. Energy consumption increased in line with the economic growth. This year the economy grew at a 2.8 percent by the government's economic measures. The government investment, private investment, households spending and the public sector are increased, although exports continued to decrease by the slowdown of global economic.The expansion in the tourism and construction sectors grew higher. While gross domestic product in the agricultural sector decreased due to the drought in many areas. Factors mentioned above affected the energy situation of the country in the year 2558 as follow
Consumption, Production and Import of Primary Energy.
The primary energy consumption in 2015 was at 2,595 thousand barrels of oil equivalent per day, increased by 1.8 percent from last year. Natural gas accounted for 35 percent of the most commonly used, followed by oil, gasoline, coal / lignite and hydroelectric power/electricity imports, respectively.
Production of primary energy in 2015 was 1,540 thousand barrels of oil equivalent per day. It’s lower down by 1.7 percent from the previous year. Lignite production is decreased due to the decrease of its demand in the Mae Moh power plant and. industrial sector. The electricity generation by hydroelectric power decreased as well from the reduction of water in reservoir and less precipitation in rainy season compared to previous year.
Imports of primary energy (net) is 1,253 thousand barrels of oil equivalent per day, increased by 6.9 percent from the previous year. Most of Energy import increased. In particular, electricity import increase by purchasing power from Hongsa power plant in Lao PDR., Which began supplying electricity to Thailand since February 2558. Imports of natural gas increased because the operation of Zortika natural gas plant in Myanmar. It started selling natural gas to Thailand. Since August 2014, together with LNG imports increased.


In 2015, value of energy imports was 912,931 million baht. It decreased 34.8 percent compared with the previous year. The low price of crude oil is the key factor that caused the decline in energy import value. World market prices of crude oil were fluctuating in the first half and steadily decline in the second half of the year. The world's oil supply was rising while the oil demand was not high due to the slowdown of the global economy. This year, prices of crude oil import averaged at 54.3 US dollars per barrel. The crude oil import is accounted for 65 percent of total energy imports. The energy import decrease due to the reduction of energy prices except the value of electricity and LNG import that increased by the import volume.
The energy situations for each type
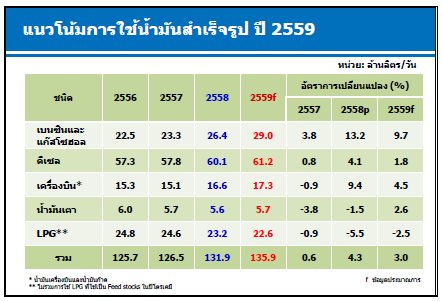
In 2015, the petroleum products consumption is at 131.9 million liters per day. It rose up 4.3 percent from a year ago. It affected by the significantly decreasing of retail oil price compared to the previous year.
- Gasoline and Gasoholconsumption is average at 26.4 million liter per day. Growing up 13.2 % compared to last year. It is affected by the increasing consumption due to the low oil price. The other affect is the turning to use LPG and NGV of Automobile users because they are cheaper with more service stations.
- - Jet Fuel consumption is average at 16.6 million liter per day. It increased 9.4% from last year. Due to the expansion in tourism sector. This year, Number of tourists visiting Thailand are 29.9 Million, increased by 5 Million from last year.
- - LPG, Propane and Butane are used at 6,695 thousand tons decreased by 10.9 percent from the previous year. The share of LPG used as a feedstock in the petrochemical industry is highest. It is about 32 per cent of total consumption. The use of LPG in this sector dropped to 20.6 percent due to the decreasing petrochemical industry and export.
In 2015, natural gas consumption was 4,764 million cubic feet per day, it is 2.0 percent up from the previous year. The use of electricity generation is the highest accounted for 60 percent of all natural gas consumption. It rose 4.3 percent. While consumption in other economic sector decline, particularly the use of NGV is down 4.1 percent from last year by the increasing of its price. The low oil price in market made people to convert NGV engine back to consume oil.
In 2015 Lignite / coal are used at 17,567 thousand tons of crude oil equivalent, down 1.8 percent from last year.
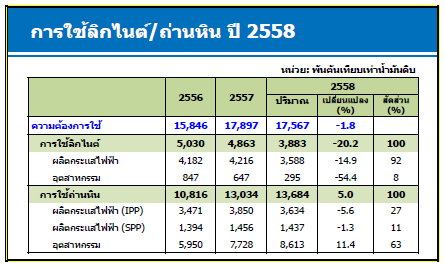
Lignite was consumed at 3,883 tons of oil equivalent, down 20.2 percent, in 2015. This is a result of the Mae Moh power plant decreased its electricity generation due to the limitations of the transmission system. The electricity generation of Hongsa Power Plant (Unit 1) 491 MW also affected by Lignite utilization. The other effect is the lower consumption in industrial sector. The imported coal consumption was 13,684 thousand tons of oil equivalent, Increased by 5.0 percent in 2015. This is the result of the increasing of coal to replace lignite consumption in the industrial sector by 11.4 percent.
Power
System Generating Capacity, as of December 2015 was at 38,815 MW. The Electricity Generating Authority of Thailand (EGAT) is the highest production capacity in the electrical system, accounted for 40%. Followed by independent power producers (IPP) accounted for 38% small power producer (SPP) for 13 % and purchase / exchange with foreign countries 9%. Net Peak Generation Requirement is occur on Thursday, June 11, 2015 at 14:02 am. The peak is at 27,346 MW up 1.5 percent from the previous year. This is because of the long period of high temperature which is at 36.7 degrees Celsius. Electric consumption is at 174,834 units, up from 3.7 percent from the previous year due to the hot weather, especially in the first half of the year.The electricity consumption in the industrial sector are slowly increased because the decrease of exports that affected by the decrease of global economic. The Consumption of electricity has increased by almost of economic sector. Except in agriculture sector declined due to drought, this resulted in insufficient water for agriculture in some areas.Electricity production in 2015 was 192,189 million units (including the production of electricity from a very small power producer; VSPP), up 3.3 percent from the previous year. The natural gas was used to produce electricity in the highest portion of 67 percent of total electricity production. The production of electricity from renewable energy which represents a 5 percent portion, increase by 10.4 percent, according to the policy of the Ministry of Energy to diversify fuel sources for electricity production.
The FT, in 2015, has been changed as follows.
No. 1: January - April 2558 at the rate of 58.96 cents per unit has decreased by 10.04 per cent.
No. 2: During May - August 2558 at a rate of 49.61 cents per unit dropped 9.35 per cent.
No. 3: during September - December 2558 at a rate of 46.38 cents per unit has decreased by 3.23 cents per unit.
Energy Trends in 2016
The economic forecast by NESDB indicated that Thailand's economy is expanding at 2.8 - 3.8 % in year 2016. With affected by the acceleration of the public spending and investment, the government economic acceleration measures and the slowly recover of the global economy. The world crude oil price will remain low. EPPO expected that the average price of Dubai crude oil in the year 2016 will be in range of 35-45 USD Per barrel. The average exchange rate in 2016 is expected to be in the range of 36.0 to 37.0 baht per USD. The energy demand forecast by EPPO under the above assumption can be summarized as follows:
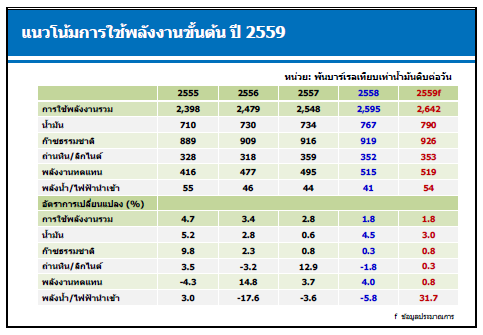
The primary energy demand in 2016 is estimated at 2,642 thousand barrels of oil equivalent per day, up 1.8 percent compared to the year 2016. It forecasts that the Energy is increasing in every type. Crude demand will increase by 3.0 percent due to the increasing of gasoline, gasohol, diesel, jet fuel and fuel oil consumption. The natural gas and renewable energy consumption is expected to increase by 0.8 percent. While the use of coal and lignite are expected to increase by 0.3 percent and the hydropower / electricity imports are expected to increase by 31.7 percent.
The petroleum products are expected to increase by 3.0 percent. Diesel demand is expected to increases 1.8% and the use of gasoline and gasohol will be increased by 9.7 percent. This is a result of the low crude oil prices in world market and the restructured of LPG prices to reflect the real cost of Ministry of energy. The use of jet fuel is expected to grow 4.5 percent, according to government policy measures to promote tourism. The tourist from Asian countries such as China and South Korea are expected to come to Thailand. The use of fuel oil is expected to rise 2.6 percent, according to the economic forecast in 2016.
While the use of LPG (not included the petrochemicals feed stock is expected to decline 2.5 percent.
LPG Propane and Butane consumption is estimated to decrease by 5.6 percent. The car demand is expected to decline 9.4 percent. This is because the restructure of LPG prices to reflect the real costs caused LPG prices to rise. While oil prices are low, therefore the LPG car will be turned to use oil instead. The use of LPG in the petrochemical industry is expected to decrease by 12.2 percent due to the impact of the export slowdown and the household sector is expected to increase by 0.2 percent and the industrial sector is expected to increase of 4.0 percent, according to the economic growth.
Natural Gas consumption is expected to increase by 0.8 percent in 2016. According to the Power Development Plan 2015 - 2036 (PDP 2015) that North Bangkok power plant, the natural gas power plant, will generate electricity with a capacity of 848.3 MW to system in January 2016 and renewed Khanom power plant unit 1 with a capacity of 930 MW will start supply electricity in July 2016. Electrical demand is expected to increase 3.5 percent compared to the year 2015, which will be expanded according to the economy growth.
FT for the electricity retail rates (in January - April 2016 period) will drop to 1.57% compared with the FT that judged to the new tariff structure, which took effect from November 2015 onwards. The FT is set to decrease 3.23 in November - December 2015. The declining in fuel prices is the main factor that effected to the reduction in the FT in January - April 2016.
The Energy Forecasting and Information Center, EPPO
As of February 26, 2016
Xayaburi Hydroelectric Power Project
Xayaburi Hydroelectric Power Project
Background
The economic growth of Thailand demand cause the electricity supply to steadily increased every year.
Ministry of Energy and the Electricity Generating Authority of Thailand have an important role to supply electricity to meet the power demand and provide adequate security with the reasonable tariff and with minimal environmental impact.
From the stated mission, Ministry of Energy and the Electricity Generating Authority of Thailand have developed power development plan (PDP) which prioritized to the domestic resources generation, Thermal power plants that use cleaner fuels such as natural gas, high quality coal, the hydroelectric Pumped and purchase from renewable electricity, etc, and which diversified to others source of fuel for power generation to achieve electricity system security.
In addition, the purchase of electricity from neighboring countries is the key option to supply electric power together with the domestic power generation. The government of Thailand has signed an MOU with the governments of neighboring countries, including Lao PDR., the Republic of the Union of Myanmar, Cambodia and the People's Republic of China to promote the production of electricity for sale to Thailand. The Xayaburi hydropower project is the one that produce electricity for sale to Thailand under a MOU between the governments of Thailand and Lao PDR
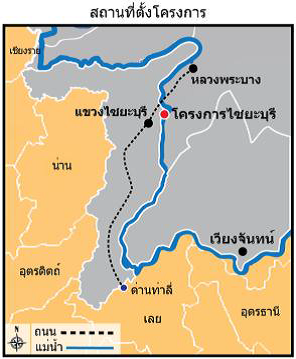
Project Description
Xayaburi hydropower project is located in Xayaburi province of Lao PDR. It was a diversion dam on the Mekong river to raise the water level on the upstream and release water along the river without the diversion of water from the river and no reservoir as others conventional dam. The Dam will raise the upstream water level close to the maximum water level in the flood season. The water from the Xayaburi province will reach the south of Luang Prabang but the downstream water levels are still at normal.
 |
 |
The Xayaburi hydro power project is a reinforce concrete dam with 810 meters long and 28.5 meters net water head. Ten floodgates were installed to produce electricity. Seven of 175 MW and one of 60 MW generators have been installed to generate electricity for sell to Thailand and Laos PDR., respectively. Total electric power generation is 1,285 MW and it can produce average 7,370 unit of electricity annually.
In this project, the dam is designed to have 12 meter wide and 120 meter long boat lane to accommodate the water transport for ships of 500 tons on the right and the fish ladder 10 meter wide for fish migration on the left. It is also designed to have the emergency spillway to drain exceed water in the flooding season. In the operation when the project is completed, water inflow and water outflow will kept constantly without water retention, so the amount of water in the Mekong Basin will naturally flow throughout the year.
Benefits of the project
When the project completed, 1220 MW electric Power or 6,929 unit of electric energy per year will be delivered to Thailand at Thailand - Laos border transmission junction for a period of 29 years, starting from the year 2019 onwards. The tariff in this project is at constant price. This means that the price will be unchanged with the change of fuel prices in the world market. It is competitive when compared to other alternatives. The border tariff is average at 2.16 baht per kilowatt - hour over the 29 years contract. While the domestic power plant such as coal and liquefied natural gas (LNG) power plant produce electricity with the average tariff in the range of about 2.90 to 4.30 baht per kilowatt - hour.
In addition, the purchase of electricity from neighboring countries is to promote economic and social relations of the two countries.
Environmental Impact management
Project developer, Xayaburi Power Company Limited, have conducted a study on the social and environmental impact. The impact on the quality of water, air, soil, forestry, wildlife and ecosystem were considered in the study. Results of the study and environmental prevention and remedial plan will be reported to the Government of Lao PDR. Because of the project located on the Mae Kong river, so the project was designed according to the guidelines of the (Mekong River Commission: MRC). The plan to reduce the environmental impact is summarized as follows:
1. Fish Ladder
The project developer will arrange a Fish Ladder of 10 meters wide, which the fish can migrate through the dam every season. As well as provide fish breeding station to ensure that there is a reasonable amount of fish to the people living along the banks of the Mekong River.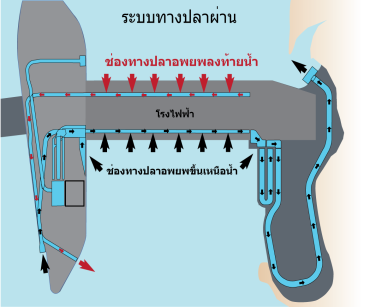
2. Boat Lane
Currently, transport and shipping cannot be done all year round because of many islands have emerged in dry season. It is obstacle to big boat navigation. The project developer will build a boat channel to accommodate larger cargo ships of 500 tons, making navigation easier than ever.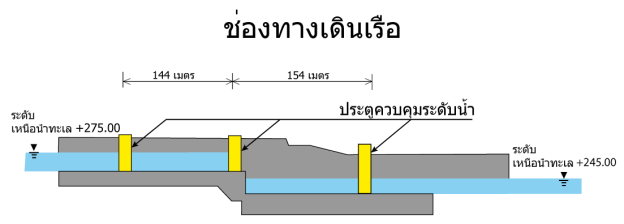
3. The Sediment Drainage
Naturally, the high suspended solid occur in flood season, with high volume and high velocity water flow in river but suspended solid will be less in the dry season. The project has a volume of water that flows naturally every day. The project release water flow through the dam without retention so the river flow rate does not change significantly from the natural flow. However, there is special drainage gate installed to release sand, sediment and aqua living feedstock in this project.
4. Bank Erosion Protection
To prevent bank erosion along the river, project will keep the river flow stable by release water flow throughout the dam every day. Therefore, water level on the upstream will be kept not exceeding 0.5 m and the downstream water level will vary in range of 1.5 m. This causes the water level above the dam does not change throughout the year and the downstream water level changes in according to the season.
More detailed information about the project design and guidelines of the MRC are available at www.mrc.com
The MRC’s project consideration
Laos PDR.’s Government has proposed Xayaburi Project to the Mekong River Commission (MRC), the member consist of Laos PDR., Vietnam, Cambodia and Thailand, in accordance to the agreement on the Cooperative for the Sustainable Development of the Mekong River Basin. The MRC Joint Committee meeting on Prior Consultation process, as part of the process Procedures for Notification, Prior Consultation and Agreement (PNPCA) with representatives of the MRC Joint Committee of Thailand, Laos, Cambodia and Vietnam to consider the construction of the dam was held on April 19, 2001 at Vientiane, Lao PDR.
For detailed information of Xayaburi project, please visit www.xayaburi.com
Thailand – Myanmar’s Energy Cooperation Projects
Thailand – Myanmar’s Energy Cooperation Projects
Thailand and Myanmar have signed a Memorandum of Understanding (MOU) on Energy on 4 July 1997 in order to develop a partnership to purchase electricity from Myanmar at 1,500 MW.
However, the MOU has expired since 2010 and therefore need to sign MOU to negotiate a new contract with Myanmar further.
Potential projects in Myanmar, including a number of projects.
The Mai – Kok project (Lignite 390 MW)
• the agreement has expired
• Currently the project developer has arranged to negotiate for the new power purchase agreement.
Hajji Project (1360 MW) and MI tong Project (7000 MW)
• Is under studying.
• It plans to develop a proposal to sell electricity to Thailand.
In addition to the above project Myanmar with abundant water resources can bring more power projects on the Salween and the Lower Salween area.
Electricity Trade between Thailand and Malaysia.
Electricity Trade between Thailand and Malaysia.
One of energy cooperation between Thailand and Malaysia is Electricity Trading through the Electricity Generating Authority of Thailand (EGAT) and Malaysia Electricity Authority (Tenaga Nasional Berhad: TNB).
At present, there are 2 main transmission line connections for power exchange between Thailand and Malaysia.
1. The HVAC transmission Line Connection (Bukit Ketri Station) with power exchange of 30 MW The power purchase agreement in which both sides made an offer for sale of electricity per month, in advance, with 3 price levels , Price A (low) ,Price B (moderately priced) and Price C (high prices).
2. The HVDC transmission line Connection (Gurun Station) with maximum power exchange of 300 MW
The power purchased through this point is Non-Firm in Bulk Energy purchase. Tier is used in term of Electricity purchased (one Tier equivalent to 25 million electricity units). The electricity rate is reversed on the volumes purchased. This price mechanism will make price low.